Bitcoin’s Three Rising Valleys Pattern Signals Heavy Institutional Accumulation as Whales Gradually Exit Near the $100K Level
Curious why Bitcoin is stuck at 100k? The answer lies in rising valleys, whale exits, and Bitcoin accumulation.

Quick Take
Summary is AI generated, newsroom reviewed.
Bitcoin’s Three Rising Valleys pattern shows strong institutional accumulation, with each dip being bought at higher levels — a classic bullish structure.
Whales are slowly exiting around the 100k mark, providing supply for ETFs and treasuries — a necessary step in Bitcoin’s broader monetization process.
Despite low volatility and sideways movement, the underlying demand remains strong, setting the stage for a potential breakout once supply pressure eases.
Bitcoin has been grinding in a tight range around the $100,000 mark, and many investors are scratching their heads. With billions of dollars in ETF inflows, treasuries buying up supply, and almost no new Bitcoin being mined, why isn’t the price shooting higher?
The answer is simpler than many realize. It lies in a classic and powerful technical formation, the Three Rising Valleys pattern. But more importantly, it reflects a broader shift in market structure. We are in a phase of Bitcoin accumulation unlike any before, and the forces driving this trend are institutional in nature.
This isn’t about speculation anymore. It’s about long-term wealth reallocation. The same whales who once refused to sell under any condition are now slowly distributing their coins to ETF buyers and corporates. The result is a “quiet bull market”, where the floor keeps rising, but the ceiling takes its time to break.
What Is the Three Rising Valleys Pattern Telling Us?
The Three Rising Valleys (3RV) pattern is widely recognized as one of the clearest indicators of bullish accumulation in technical analysis. It is defined by three successively higher lows, forming a stair-step structure that reflects increasing demand at elevated price levels. In Bitcoin’s current cycle, this pattern has unfolded with striking clarity. The first valley took shape during the March correction, finding support near the $73,000 level.
The second valley emerged in April, this time holding just above $80,000. Now, the third valley is forming in the $97,000 to $100,000 range, a powerful signal that buyers are consistently stepping in at higher and higher price floors. Each dip is aggressively bought, but more importantly, each low is higher than the last. That’s not retail behavior, that’s institutional Bitcoin demand playing out in real time.
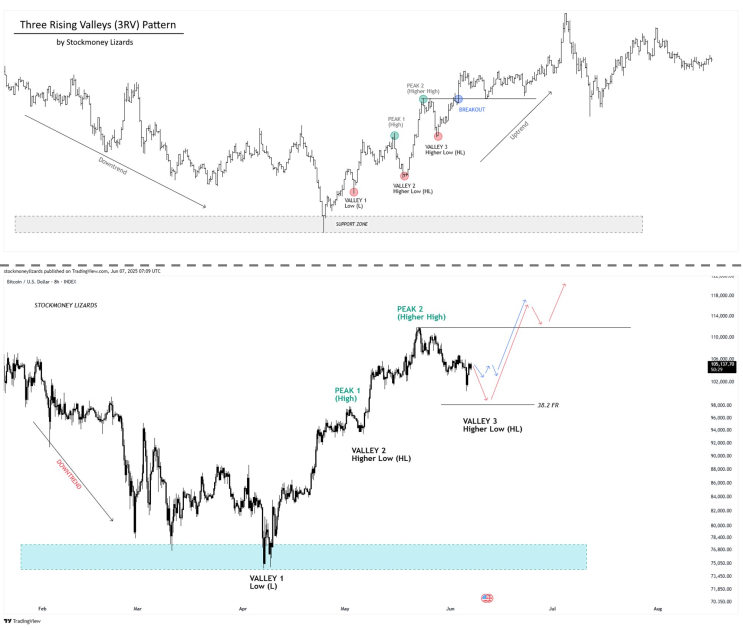
Image 1: Three Rising Valleys (3RV) Pattern. Source: Stockmoney Lizards
What Happens Next: Two Likely Scenarios
At this stage, the Bitcoin chart is signaling strong underlying demand, and two possible short-term scenarios could play out. In the first, Bitcoin may continue to consolidate between the $100,000 and $105,000 range before staging a clean breakout. In the second, the price could dip slightly toward the $94,000 to $97,000 zone, a move likely to be met with aggressive buying, once again leading to an upward breakout.
Regardless of which scenario unfolds, the core takeaway remains the same: Bitcoin accumulation is accelerating. These dips are no longer reasons to panic, they’re opportunities. Ironically, if a pullback does occur, many retail traders may interpret it as a double top and either short the move or sell in fear. That very reaction, however, could end up fueling the next leg higher.
Why Whales Are Selling at 100k Now, Not Months Ago
A lot of people ask, if $100k was a psychological target for early holders, why didn’t they sell months ago when Bitcoin broke its previous all-time high? The reason is simple. Back then, the conviction around institutional inflows wasn’t as strong. ETF flows were still fresh, and the post-halving supply crunch hadn’t set in yet. But now, the narrative is clearer: Bitcoin is entering a new phase of monetization.
Large holders are finally comfortable letting go of coins they’ve held for years. This process isn’t bearish, it’s healthy. Without this kind of distribution, Bitcoin could never reach global scale. So yes, some whales are selling. But every sale is being absorbed by entities that are far more likely to hold, institutional allocators, funds, treasuries, and ETFs.
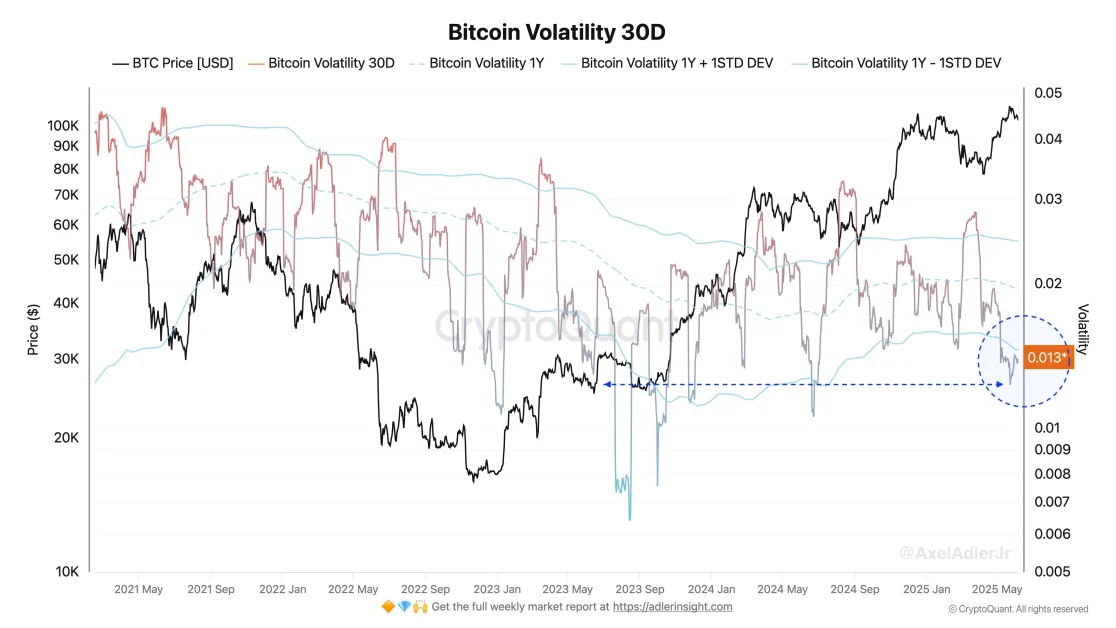
Image 2: Bitcoin Volatility 30D. Source: Axel Adler Jroney Lizards
Is Paper Bitcoin Suppressing the Market?
Some argue that the price is being artificially suppressed by “paper Bitcoin”, synthetic derivatives and leveraged products that don’t involve real spot buying. While this may play a small role, it’s not the main driver here. The dominant force is the balance between whale selling and new demand. And right now, that balance is perfectly matched, which is why we’re stuck in this narrow band. At some point, the whales will finish their diversification. And when that supply dries up, the same demand that has been patiently buying every dip will push the price through the next major level, potentially toward 120k and beyond.
Why You Shouldn’t Fear Low Volatility or Slow Moves
Right now, 30-day Bitcoin volatility is sitting at extremely low levels, below minus one standard deviation from the annual norm. This is a tightly wound spring. Historically, such compression doesn’t last. When the breakout happens, it tends to be fast and violent. The key is not to get shaken out during these slow periods. They are often the final phase of accumulation before liftoff. Smart money knows this. It’s why they are buying, not selling.
The Grind Is the Setup
What looks like boredom or weakness to most is actually quiet strength. Bitcoin is showing a textbook Three Rising Valleys pattern, backed by deep-pocketed buyers who are stepping in at higher levels each time. The process of Bitcoin accumulation is still underway, and every dip confirms that the floor is rising. This is not the time to panic or chase headlines, it’s a time to understand the structure and the shift happening underneath. Whales are distributing, institutions are absorbing, and the next big move is only a matter of when, not if.
References
- The Three Rising Valleys pattern is screaming at you. Each valley higher than the last - Valley 1 at the March lows around 73k, Valley 2 in April, and now Valley 3 forming around 97-100k. Classic accumulation structure.
- 30-day BTC volatility has moved below −1 annual STDDEV - this is a very low level, essentially the spring is highly compressed.
- Why is Bitcoin's price stuck? There are billions in inflows from ETFs and treasury companies and the supply of newly mined Bitcoin is miniscule compared to these flows. What gives?
- Sure, could be true but then my question is, if you have $100k as a target to sell, why didn't you sell 7 months ago?
Follow us on Google News
Get the latest crypto insights and updates.
Related Posts

ALEX Labs Confirms Major Security Breach, Suspends Platform Operations, and Launches Full Investigation Into Multi-Asset Hack
Mikaeel
Author

Squads CEO Stepan Simkin Responds to Jack Zhang’s Stablecoin Skepticism, Emphasizing Stablecoin’s role in Enabling Fintech 3.0 with Programmable Finance and Faster Scaling
Mikaeel
Author

Stablecoins Now Power Over 60% of On-Chain Transactions with TRON Emerging as a Leading Settlement Layer Driving $230B+ in Global Digital Finance
Kanishka Bothra
Author
Loading more news...