Dogecoin Price Analysis of March 5, 2025: Can a Breakout Above $0.204 Trigger Bullish Momentum?
Let's dive into Dogecoin price analysis, learn about the major breakouts and price action, and understand the scope of investment.
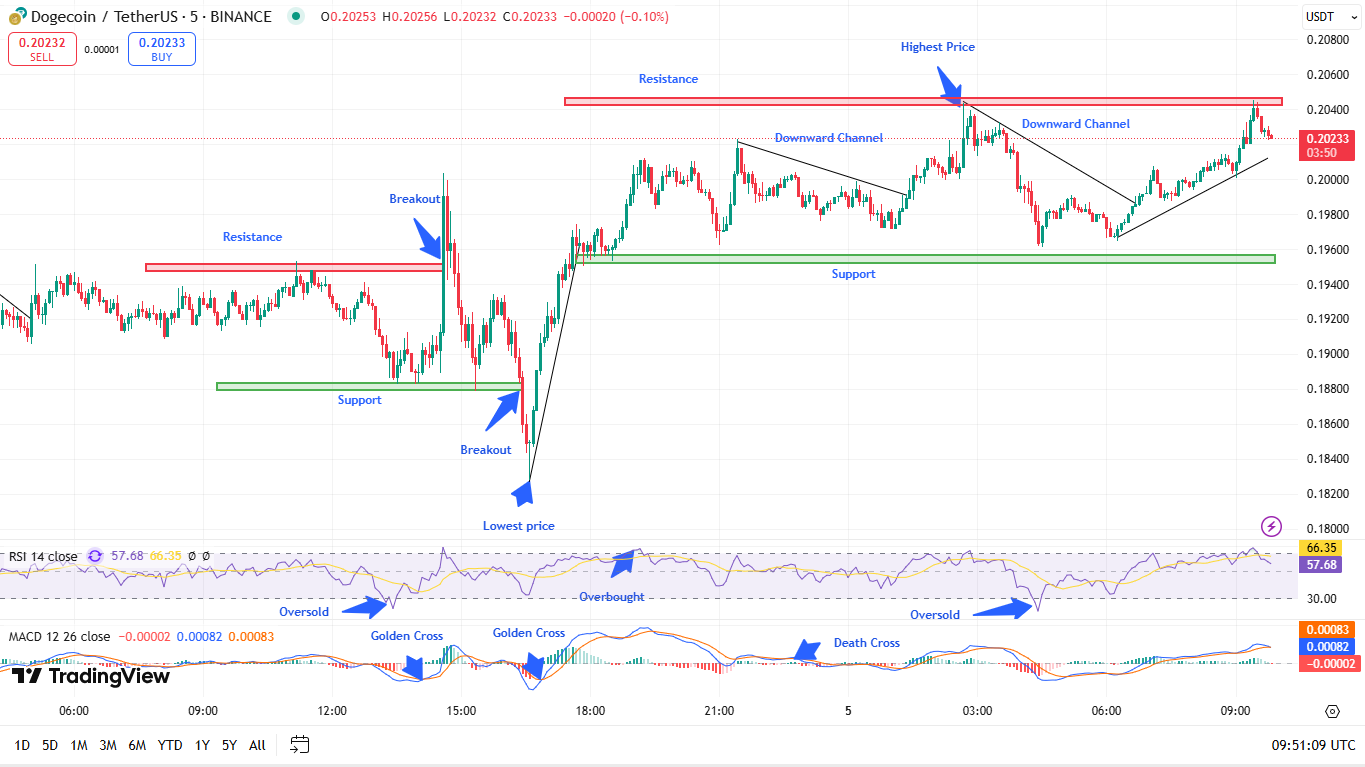
Are you interested in Dogecoin price analysis to learn about a better investment scope? The price movements of Dogecoin (DOGE) on March 5, 2025, displayed significant variations mainly throughout the last few days while maintaining substantial volatility and continuous price movement on the 5-minute Binance platform. The price has maintained a defined boundary while it tested important resistance and support points several times. The market movements and significant changes are observable with DOGE breakouts and downward channels, as well as overbought and oversold RSI levels and both golden and death cross formations on the chart.
Analyzed by baishnabtriparna, published on Tradingview, March 5, 2025
As of 09:56 UTC, DOGE is trading at $0.20243, reflecting a 0.21% increase. The price has seen a high of $0.206 and a low of $0.182 in the observed period. These levels have played a critical role in shaping the short-term trend.
Key Testing Levels
The essential support zone for DOGE exists at $0.194 where it has faced multiple verification attempts. Strong buying pressure from investors has consistently blocked DOGE from falling when it gets close to this vital price zone at $0.194. The price level of $0.194 functions as a powerful demand area that signifies potential buyer intervention because market participants are ready to invest at this point.
The DOGE price trend encountered numerous rejection points at $0.204, which later developed into a downward-moving trend. Multiple trading attempts at price levels above $0.204 resulted in rejection from aggressive sellers who maintain their stand at this zone. The price reached its most recent resistance zone at $0.206 when the market recorded its maximum value in this period. There is a strong possibility of DOGE developing upward price action when it maintains support above the $0.204 – $0.206 price area.
Technical Indicators
A DOGE breakout happened when a downward movement occurred in DOGE at 15:00 UTC that dropped the price from $0.194 to reach its lowest point at $0.182 before recovering. A major price breakdown occurred as the RSI generated an oversold signal, which shows potential entry points for buyers in the market. The market executed a strong comeback following the initial reaction and DOGE started recovering its bullish trend at 15:30 UTC. The currency value reversed direction and exceeded $0.194 before reaching $0.202. The bullish trend confirmation came after a golden cross developed on the MACD indicator which showed a rising bullish momentum.
Relative Strength Index indicators display significant price change points that affect DOGE’s market direction. An RSI value less than 30 emerged at 15:00 UTC, which indicated market oversaturation and matched the $0.182 price low, thus presenting a solid purchase chance. Price trends receive additional support from the Moving Average Convergence Divergence analysis (MACD). The price rose sharply starting at 15:30 UTC because of the bullish crossover, which manifested as a golden cross pattern. The second bullish golden cross at 18:00 UTC UTC validated the rising trend direction at 0.206.
Future Price Forecast: Trend Analysis
The market entered the Downward Channel Formation after reaching $0.206. Dogecoin price analysis states that it continues descending through a downward pattern after forming new high levels followed by new low levels. The price shows significant buying interest because it rebounds from the $0.194 support level consistently. The current DOGE price trend needs to break through its downward trend before a bullish outlook becomes possible since the market seems set to remain consolidated between $0.194 and $0.202. The current DOGE price movement suggests an upcoming bullish surge if it crosses past the $0.204 threshold. Market participants need to monitor RSI and MACD indicators for indicating trading trend direction changes.

Coinfomania News Room
Author
Newsroom is the editorial team of CoinfoMania, delivering 24/7 crypto news, market insights, and in-depth analysis. With 30+ journalists worldwide, we keep you ahead in the blockchain space.
Related Posts

Ethena Labs Brings Daily Rewards with USDe on HyperCore and HyperEVM
Emmmaculate Araka
Author

President Trump Announces Exclusive Dinner for Top $TRUMP Holders in Washington on May 22
Buvaneswari
Author

Kaspa Enhances Blockchain Speed with Crescendo Upgrade
Emmmaculate Araka
Author
Loading more news...