TRON Price Analysis of March 6, 2025: TRON Broke the $0.2459 Resistance Level, What’s Next?
Let's dive into the TRON price analysis of March 6, 2025, and explore the recent breakout probability to sustain.
Author by
Coinfomania News Room

After an initial spike, TRON remained range-bound in the last trading session as the TRON price today broke the resistance level. This sparked interest in traders and investors because TRON fluctuated between key levels in the last trading session. If you are tracking TRON, then this analysis is going to help you determine what this breakout means in a higher timeframe. As we go through the analysis, we will determine the key support and resistance levels. Without any further delay, let’s dive into the TRON price analysis.
TRON Price Analysis of the Last 24 Hours
An expanding triangle appeared in TRON, which broke out to the downside at 03:45 UTC after marking the high for the day on 5th March at $0.2450. At 03:45 UTC, RSI dropped below the level of 30, suggesting a pullback in the price of TRON. At 04:45 UTC, MACD showed a golden cross, further indicating a bullish momentum building up after the initial down spike from the expanding triangle. The price formed a downward-moving channel, which broke out to the upside and formed a spike at 10:30 UTC. RSI moved above the level of 70, suggesting a pullback, which was further corroborated by a death cross in MACD at 11:35 UTC.
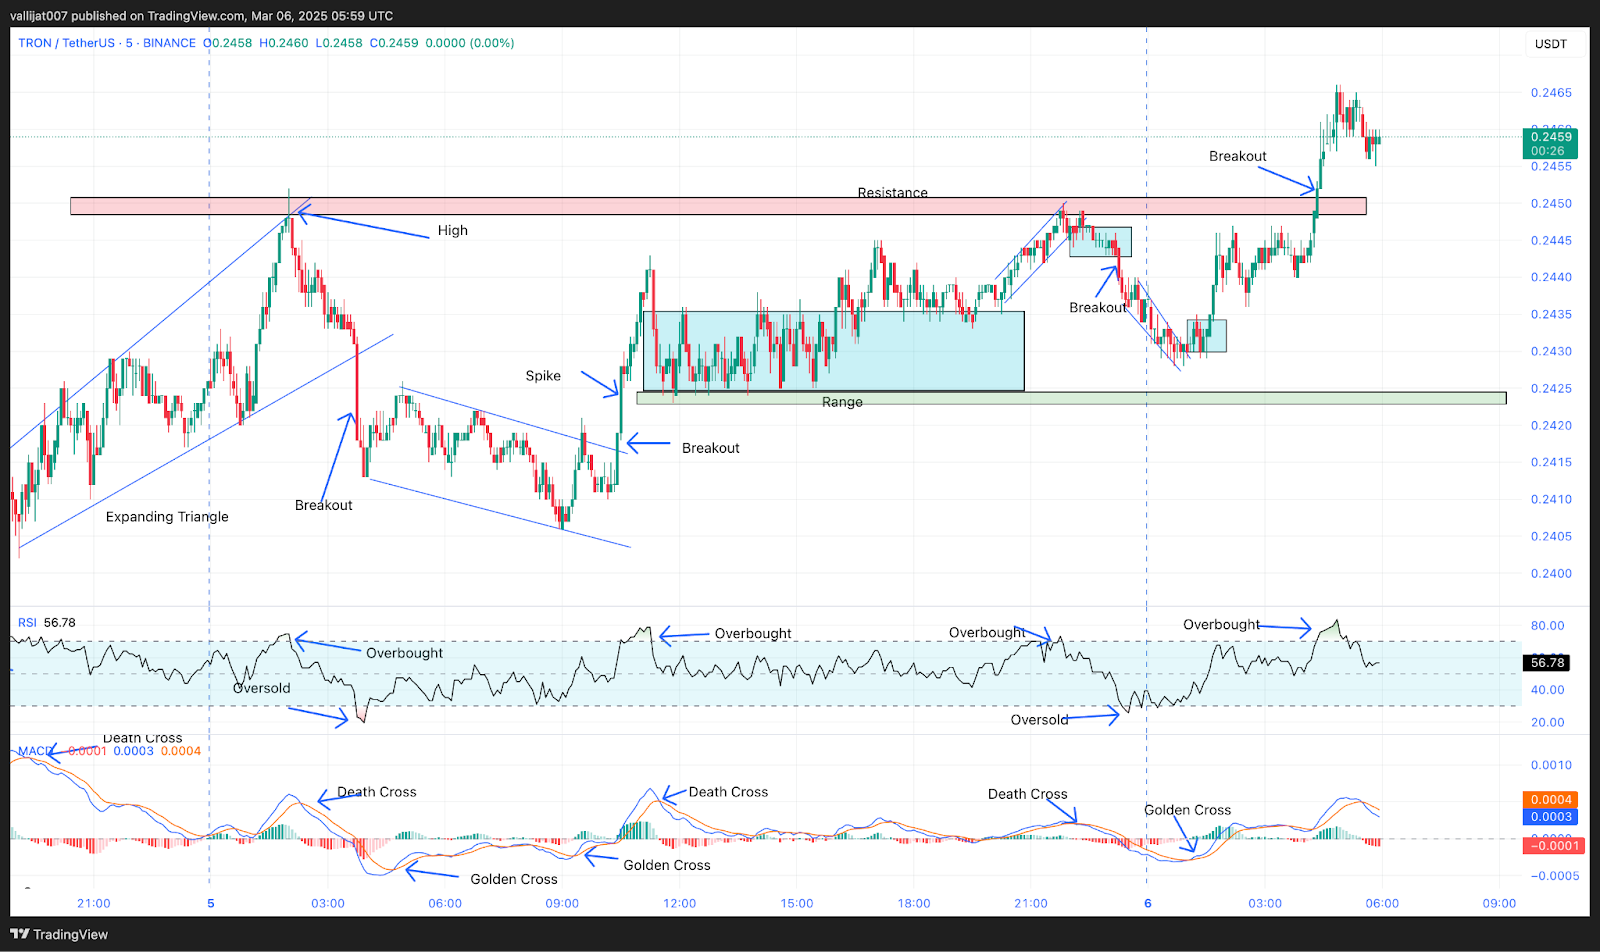
Chart 1: Analysed by vallijat007, published on TradingView, March 6, 2025
The price formed a range, which attempted to break out to the upside at 16:00 UTC but failed to form a spike as the price moved toward the resistance level of $0.2450. A channel appeared, which broke out to the downside and formed a minor range. The minor range broke out to the downside, followed by a spike and channel pattern.
Potential Breakout or Reversal: TRON Price at Critical Levels
A golden crossover appeared in MACD at 11:10 UTC, suggesting a reversal or at least a pullback. The price broke out from the downward-moving channel and formed another minor range. This range again broke out to the upside, pushing the price towards the resistance level of $0.2450. At 04:20 UTC, the price broke out from the resistance level and formed a spike. At the same time, MACD showed a golden crossover. If the price sustains above the resistance level, a bullish momentum could be seen. However, if it fails, then the price may drop to the level of $0.2400, which is also a support level.
TRON Price Today: Breakout or Fakeout?
The above analysis showed the range-bound movement yesterday, and the TRON price today broke above the resistance level. In the higher timeframe, TRON is in a larger range-bound market. To sustain the bullish momentum from previous days, it is critical for TRON not to drop below the resistance level, which now acts as support. TRON traders and investors should be cautious while taking positions to the upside, as sellers in higher timeframes are ready to sell if they get better prices. Taking a look at a higher timeframe every time is good practice because it gives a holistic view of the market trends, and potential support and resistance are clearly visible.

Coinfomania News Room
Editor
Related Posts

Cardano Approaches Critical $0.720 Resistance With ADA Breakout Toward $0.750 Ahead
Archisha Mondal
Editor

Bitget and Avalanche Unite to Supercharge India’s Web3 Revolution

XRP Approaches Multi-Month Highs With ProShares ETF Approval, Is the Uptrend Toward $3 Imminent?
Emmmaculate Araka
Editor
Loading more news...